
Purpose and scope
Atterberg Limits Tests. Determine the water contents that define changes in soil consistency. This guide covers the liquid limit (LL), plastic limit (PL), plasticity index (PI), and remoulded shrinkage limit (SL), including laboratory procedures, calculations, and blank records. Liquid limit procedures include both the Casagrande cup and cone penetration methods.
Use the results for material characterisation, soil classification inputs and specified earthwork checks. These index tests do not directly measure allowable bearing pressure, field compaction or swell pressure.
Test identity principles and references
| Field | Entry |
| Project/client / laboratory | |
| Report no. / sample ID / test no. | |
| Site/borehole / chainage / depth | |
| Soil description/source/sampling date | |
| Received date / test date / tested by | |
| Sample history | Natural [ ] Air-dried [ ] Oven-dried [ ] Unknown [ ] |
| LL method / tests requested | Cup [ ] Cone [ ] PL [ ] PI [ ] SL [ ] |
| Preparation fraction / soaking interval | Passing 425 µm [ ] Interval: ______ h |
| Checked by / authorised signatory |
Consistency limits
| Limit or index | Meaning |
| Liquid limit LL | Conventional boundary between plastic and liquid behaviour, defined by the selected laboratory method. |
| Plastic limit PL | Water content at the thread-rolling endpoint between plastic and semisolid behaviour. |
| Shrinkage limit SL | Water content below which further drying does not reduce soil volume. |
| Plasticity index PI | LL − PL; the water-content interval over which soil is plastic. |
Indian Standard basis
IS 2720 (Part 5):1985 — Determination of liquid and plastic limit. IS 2720 (Part 6):1972 — Determination of shrinkage factors. BIS listings checked on 8 October 2026 identify these editions. Use controlled copies with applicable amendments and the approved laboratory procedure.
Supporting references include IS 2720 Part 1 for sample preparation and Part 2 for water content; IS 9259 for cup apparatus; IS 11196 for cone apparatus; and the applicable rounding rules. Record the method and apparatus basis in the report.
Cup and cone liquid limits can differ. Identify the selected method and retain its own curve; do not combine observations from the two methods.
Apparatus and fine soil preparation
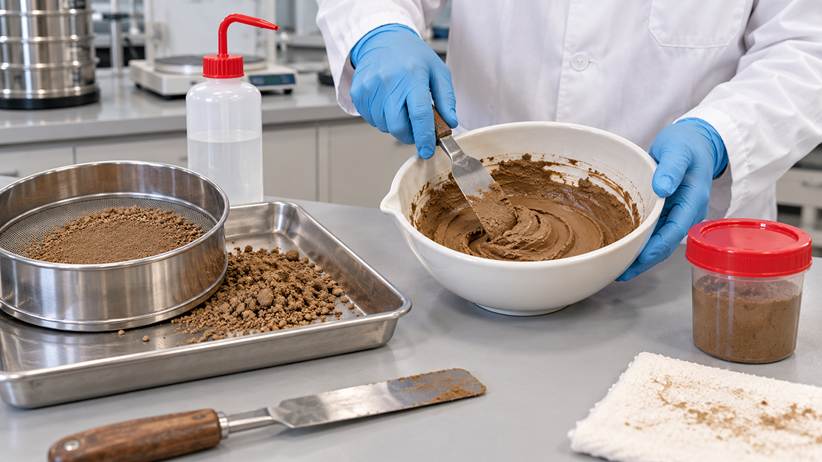
Figure 2 Preparing a uniform paste from the fine soil fraction with distilled water
Equipment and readiness
Provide the selected liquid limit device, correct grooving tool or cone assembly, 425 µm sieve, mixing dish and spatula, distilled-water bottle, ground-glass rolling plate, 3 mm reference rod, airtight moisture tins, balance readable to 0.01 g and drying oven. For SL, add the specified shrinkage dishes, volume-measurement apparatus and desiccator.
1. Verify the sample identity, preparation history and test request. Preserve a separate specimen with natural water content when a liquidity or consistency index is required.
2. Prepare a representative passing-425 µm fraction under IS 2720 Part 1. Record drying, wet sieving and any treatment; do not crush individual particles to force them through the sieve.
3. Mix the fine soil with distilled water to a uniform paste without dry lumps. Allow clayey paste to equalise in an airtight container, typically for 24 hours as prescribed in Part 5; record the actual interval.
4. Remix before testing and prevent evaporation between trials. Select enough prepared material for the chosen procedures, repeat readings and moisture samples. Use a consistent preparation history for related LL and PL results.
Equipment IDs calibration validity and checks __________________________________________________
Sample preparation and conditioning notes __________________________________________________
Liquid limit by Casagrande cup
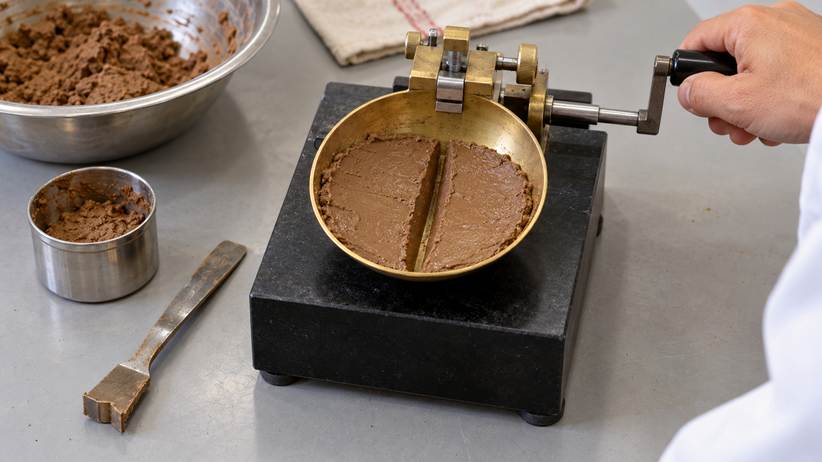
Figure 3 Cup device and grooved soil pat before the closure endpoint
Cup procedure
1. Clean and inspect the cup, hinge, base and grooving tool. Adjust the cup drop to 10 mm using the correct gauge; check for excessive wear or side play.
2. Begin with paste that requires about 30–35 drops. Spread it over the cup contact region to a maximum thickness of about 10 mm and cut a clean standard groove with the prescribed tool.
3. Turn the crank at approximately two revolutions per second. Count drops until soil flows together at the groove bottom over about 12 mm. Reject closure caused by sliding of the entire pat.
4. Rework and repeat at the same consistency until two consecutive runs give the same number of drops. Take representative soil across the closed-groove region for water content and promptly identify the tin.
5. Add water incrementally, remix and repeat. Obtain at least four points distributed within 15–35 drops, bracketing 25. Do not add dry soil to adjust a wet paste.
6. Plot water content on an arithmetic vertical axis and number of drops on a logarithmic horizontal axis. Fit the flow line and read LL at 25 drops; report the cup LL to the nearest whole percentage.
Record actual drop counts, endpoint behaviour and paired moisture results. A visually closing groove alone is not a valid endpoint if the soil slides.
Cup ID grooving tool and drop check __________________________________________________
Liquid limit by cone penetration
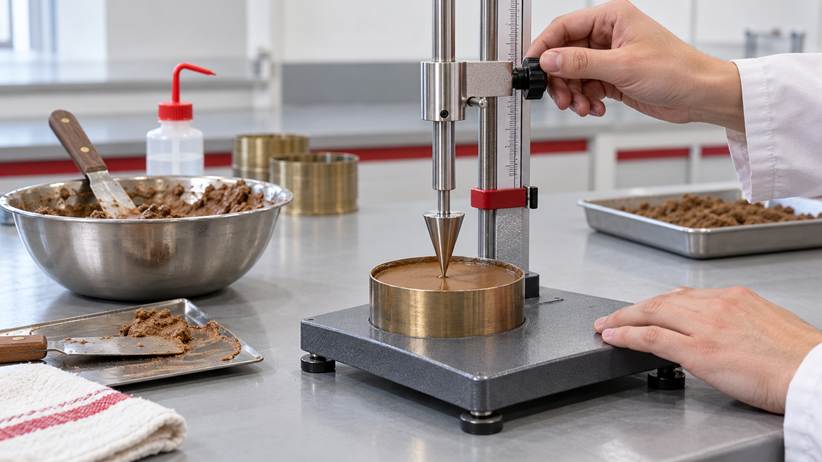
Figure 4 Cone positioned at the smooth soil surface before release
Cone procedure
1. Confirm that the cone apparatus conforms to the applicable IS 11196 requirements. Check cone mass, apex condition, geometry, free movement, release mechanism and gauge. Record these checks rather than borrowing settings from another cone system.
2. Work the paste uniformly into the specimen cup without entrapping air. Level the surface and centre it under the cone. Lower the cone until its tip just touches the soil; note or zero the initial reading.
3. Release the cone freely under its own weight. Read penetration after 5 seconds at the prescribed resolution. Do not push the cone, vibrate the bench or allow it to contact the cup bottom.
4. Determine water content for that trial. Adjust paste moisture and repeat to obtain at least four paired values in the 14–28 mm range, distributed around 20 mm. Refill or rework the paste as necessary to avoid previous penetration holes.
5. Plot water content against penetration on arithmetic axes and fit the best straight line. Read the water content at 20 mm as LL; report cone LL to one decimal place under the cited method.
This guide umass/geometryint cone procedure. Any approved one-point method must be identified and calculated under its own controlled procedure.
| Cone check | Entry |
| Apparatus ID/calibration valid to | |
| Cone mass/geometry/tip condition | |
| Timer / gauge / free-release check |
Plastic limit by thread rolling
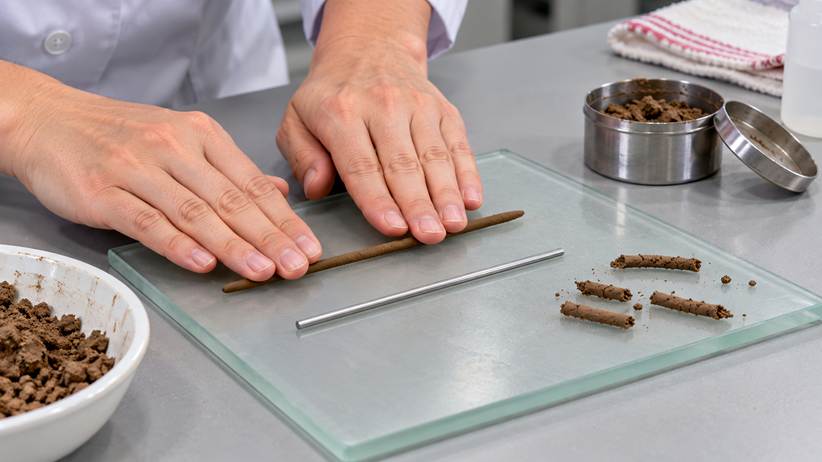
Figure 5 Rolling soil beside the diameter reference rod and collecting crumbled threads
Plastic limit procedure
1. Use about 20 g of representative passing-425 µm material. Mix to a plastic consistency and equalise moisture as required; related LL and PL portions should have consistent preparation history.
2. Form a ball using about 8 g and roll it with the fingers on the ground-glass plate using sufficient uniform pressure to produce a thread. Compare diameter with the 3 mm rod.
3. Roll at 80–90 complete forward-and-back strokes per minute. At 3 mm diameter, knead the material together and repeat rolling. Continue until the thread crumbles under the pressure needed to roll it.
4. A crumbly thread slightly thicker than 3 mm can be a valid endpoint if it was successfully rolled to 3 mm immediately before. Do not manufacture failure by reducing pressure or stopping deformation at exactly 3 mm.
5. Immediately collect crumbled pieces in an identified airtight tin and determine water content. Test at least three portions; report the mean PL to the nearest whole percentage.
Nonplastic and inconsistent results
If PL cannot be determined in a sandy soil, report PI as NP (nonplastic) under the cited reporting rule. When PL is equal to or greater than LL, Part 5 specifies reporting PI as zero; investigate preparation, method and endpoint errors before release. Do not report a negative PI or invent a numerical PL for a nonplastic material.
Rolling surface endpoint and repeat observations __________________________________________________
Shrinkage limit specimen and workflow
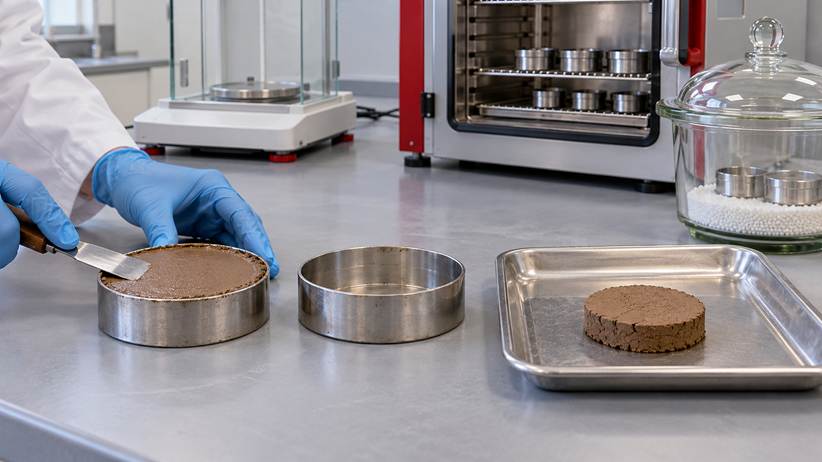
Figure 6 Wet shrinkage specimen and a dry soil pat after moisture loss
Remoulded shrinkage limit workflow
1. Prepare representative passing-425 µm soil and a workable paste that can fill the shrinkage dish without trapped air. Identify the dish and determine its tare mass and capacity by the controlled Part 6 procedure.
2. Apply the specified thin release coating. Fill the dish in stages, gently removing air; strike the surface flush, clean the outside and record dish-plus-wet-pat mass promptly.
3. Allow the pat to dry gradually before oven drying at the prescribed temperature. Cool in a desiccator and record dish-plus-dry-pat mass; preserve the complete pat and note cracking or lost fragments.
4. Determine dry-pat volume under the approved volume-measurement procedure. The cited Part 6 reference uses mercury displacement; perform that stage only with the laboratory’s authorised mercury procedure, trained personnel and suitable containment and exposure controls.
5. Record wet and dry soil masses and corresponding volumes. Calculate SL for each valid specimen and obtain at least three determinations; apply the controlled repeatability criterion before averaging.
A volume obtained by another method must be identified and approved; do not claim it is the Part 6 mercury procedure. Do not immerse an unprotected dry pat directly in water.
This section addresses remoulded SL. Undisturbed shrinkage limit and linear shrinkage are separate procedures; specify them explicitly if requested. The illustration shows specimen preparation and drying, not mercury handling.
Editable liquid limit observation sheet
Project: __________________ Sample ID: ______________ Date: _______reading/endpointp [ ] Cone [ ] Apparatus ID: __________ Operator: __________
Sample history: __________________ Conditioning interval: ______ h
| Measurement | Trial 1 | Trial 2 | Trial 3 | Trial 4 | Trial 5 |
| Cup drops N or cone penetration d (mm) | |||||
| Repeat reading/endpoint check. | |||||
| Moisture tin ID | |||||
| Tin mass A (g) | |||||
| Tin + wet soil B (g) | |||||
| Tin + dry soil C (g) | |||||
| Water mass B − C (g) | |||||
| Dry soil mass C − A (g) | |||||
| Water content w (%) | |||||
| Trial remarks/validity |
Moisture calculation and drying record
w (%) = [(B − C) / (C − A)] × 100
Use IS 2720 Part 2 and the prescribed drying conditions. The normal range for ordinary mineral soils is 105–110 °C; heat-sensitive soils require the appropriate method conditions. Dry to constant mass, cool as prescribed and weigh promptly. Check B ≥ C > A.
| Record | Entry |
| Balance ID/calibration valid to | |
| Oven ID / set and checked temperature | ______ / ______ °C / ______ °C |
| Drying start / finish / constant-mass check | |
| Curve attachment and reviewer |
Cup curve: arithmetic w versus log₁₀(N); LL at N = 25.
Cone curve: arithmetic w versus d; LL at d = 20 mm.
Invalid trials reason disposition and repeats __________________________________________________
Editable plastic and shrinkage limit records
Sample ID: ______________ Date: ______________ Tested by: ______________
Plastic limit record
| Measurement | Portion 1 | Portion 2 | Portion 3 |
| Moisture tin ID | |||
| Tin A (g) | |||
| Tin + wet soil B (g) | |||
| Tin + dry soil C (g) | |||
| Water B − C (g) | |||
| DryID/tare A (g) | |||
| PL water content (%) | |||
| Endpoint / valid reading |
Mean PL: ______ % | Reported PL: ______ % | Nonplastic observation: __________
Remoulded shrinkage limit record
| Measurement | Specimen 1 | Specimen 2 | Specimen 3 |
| Shrinkage dish ID/tare T (g) | |||
| Dish + wet pat (g) | |||
| Dish + dry pat (g) | |||
| Wet soil mass Mwet (g) | |||
| Dry soil mass Mdry (g) | |||
| Wet volume Vwet (cm³) | |||
| Dry volume Vdry (cm³) | |||
| Initial water content w (%) | |||
| Calculated SL (%) | |||
| Validity/repeat reference |
Volume procedure/reference: _________________________________________________
Volume instrument and density assumptions: _____________________________________
Mean valid SL: ______ % | Review of scatter: _________________________________
Part 6 calls for at least three determinations and repeat of a value outside its specified agreement with the mean. Use the controlled standard criterion and retain the discarded reading with the reason; do not silently select favourable results.
Calculations and example structure
Limits and derived indices
| Calculation | Formula or basis |
| Water content | w = (B − C) / (C − A) × 100 |
| Liquid limit | Cup: w at 25 drops; cone: w at 20 mm penetration |
| Plastic limit | Mean water content of at least three valid portions |
| Plasticity index | PI = LL − PL, subject to Part 5 reporting exceptions |
| Liquidity index | IL = (wn − PL) / PI |
| Consistency index | IC = (LL − wn) / PI |
| Cup flow index | IF = (w₁ − w₂) / log₁₀(N₂ / N₁), using points on the fitted line with N₂ > N₁ |
| Toughness index | IT = PI / IF |
| Remoulded shrinkage limit | SL = [(Mwet − Mdry) − ρw(Vwet − Vdry)] / Mdry × 100 |
Masses are in grams and volumes in cm³. Use the water density ρw consistent with the method; approximately 1 g/cm³ for ordinary laboratory calculation. Natural water content wn must be independently measured. Do not calculate IL or IC when PI = 0 or NP, or IT when IF = 0 or unavailable.
Training arithmetic only
These values illustrate calculations and are not project findings.
Moisture tin: A = 20 g, B = 34 g, C = 30 g.
w = (34 − 30) / (30 − 20) × 100 = 40%.
Separate illustrative limits: LL = 44%, PL = 26%, wn = 35%.
PI = 44 − 26 = 18 percentage points.
IL = (35 − 26) / 18 = 0.50; IC = (44 − 35) / 18 = 0.50.
Project calculation blanks
LL = ______ % by ______ method; PL = ______ %; PI = ______.
wn = ______ %; IL = ______; IC = ______; IF = ______; IT = ______.
SL = [(______ − ______) − ______ × (______ − ______)] / ______ × 100
Calculated SL = ______ %; mean valid SL = ______ %.
Retain calculation precision until final reporting. Cup LL and PL are reported as whole percentages, zero-free, to one decimal under the cited method. Apply the controlled rounding and reporting rules to indices and shrinkage factors.
QA QC precautions and common errors
| Release check | OK / HOLD / N/A | Evidence or action |
| Sample identity history and fine fraction recorded | ||
| Selected LL method and apparatus basis confirmed | ||
| Cup drop tool wear rate and true flow checked | ||
| Cone tip zero-free release and prepared, checked | ||
| Moisture equalisation evaporation and tins controlled | ||
| Four valid LL points bracket the target | ||
| Three valid PL portions and endpoint reviewed | ||
| SL volumes pat integrity and repeatability reviewed | ||
| Curve units, exceptions, and report checked |
Common errors and corrective action
| Error | Practical response |
| Cup pat slides instead of flowing | Reject the reading; re-prepare and assess method applicability. |
| Cup and cone data mixed in one curve | Separate the records and report the actual method. |
| Water added treated as measured moisture | Determine water content from the paired trial sample. |
| PL failure forced at exactly 3 mm | Repeat with proper rolling and kneading to a valid endpoint. |
| Moisture lost before tin weighing | Review exposure and obtain a valid representative repeat. |
| Damaged SL pat or uncertain volume | Record damage and repeat with a valid volume determination. |
| Negative PI released without review | Investigate LL / PL and apply Part 5 reporting exceptions. |
Practical precautions
Keep apparatus and samples clean, prevent dust contamination, and maintain consistent sample preparation. Keep hands clear of the cup cam, protect the cone tip, and use appropriate tools for hot tins. Mercury-volume work belongs under the laboratory’s specific chemical controls; this guide does not replace that procedure.
HOLD disposition corrective action and reviewer ___________________________index/toughness______
Reporting interpretation and record notes
| Result summary | Entry |
| Report no. / sample ID / tested dates | |
| Liquid limit and method | ______ % Cup [ ] Cone [ ] |
| Plastic limit | ______ % / Not determinable [ ] |
| Plasticity index | ______ / NP [ ] |
| Remoulded shrinkage limit | ______ % / Not tested [ ] |
| Natural moisture / IL / IC when required | ______ % / ______ / ______ |
| Flowindex/toughnesss index when required | ______ / ______ |
| Curves raw records and repeat references | |
| Specification clausrequirement/decisionon | Clause: ______ Pass [ ] Fail [ ] Not assessed [ ] |
Interpretation and site use
Compare the results with the specified material limits using the same test method and preparation basis. PI describes a plasticity interval; it is not the percentage of clay particles. Combine index results with grading and the applicable classification procedure. Neither high LL nor low SL alone establishes a design swell pressure or settlement prediction.
Sample source grading history and preparation __________________________________________________
Unusual behaviour deviations and repeat reasons __________________________________________________
Tested by: __________________ Date: __________
Checked by: _________________ Date: __________
Authorised signatory: __________________ Date: __________
References
BIS, IS 2720 Part 5:1985, liquid and plastic limit; Part 6:1972, shrinkage factors. Status search: https://www.bis.gov.in/know-your-standard/. Confirm controlled editions and amendments before use.
Public reference copies: https://law.resource.org/pub/in/bis/S03/is.2720.5.1985.pdf and https://law.resource.org/pub/in/bis/S03/is.2720.6.1972.pdf
Supporting references: IS 2720 Parts 1 and 2; IS 9259; IS 11196; applicable IS 2 rounding rules. Kerala PWD Quality Control Laboratory Manual.
Professional disclaimer
Civil Practical Knowledge provides this guide and editable record for practical training and laboratory documentation. Controlled standards, approved procedures and project specifications govern testing and acceptance. The laboratory is responsible for equipment, sample preparation, chemical controls, calculations and authorised reporting. Illustrations, training arithmetic and blank fields are not certified test results or approval for construction or design.